Is the Job Market Bad, or Is It Just You?
It’s not you, and it’s also not a crash. It’s a market where almost nobody is being fired and almost nobody is being hired — and that specific combination is uniquely miserable to job-hunt in.
The federal data says both things at once, which is why the vibes are so confusing.
The 30-second version
- 7.3 million open jobs in July 2026 — that’s a lot of jobs.
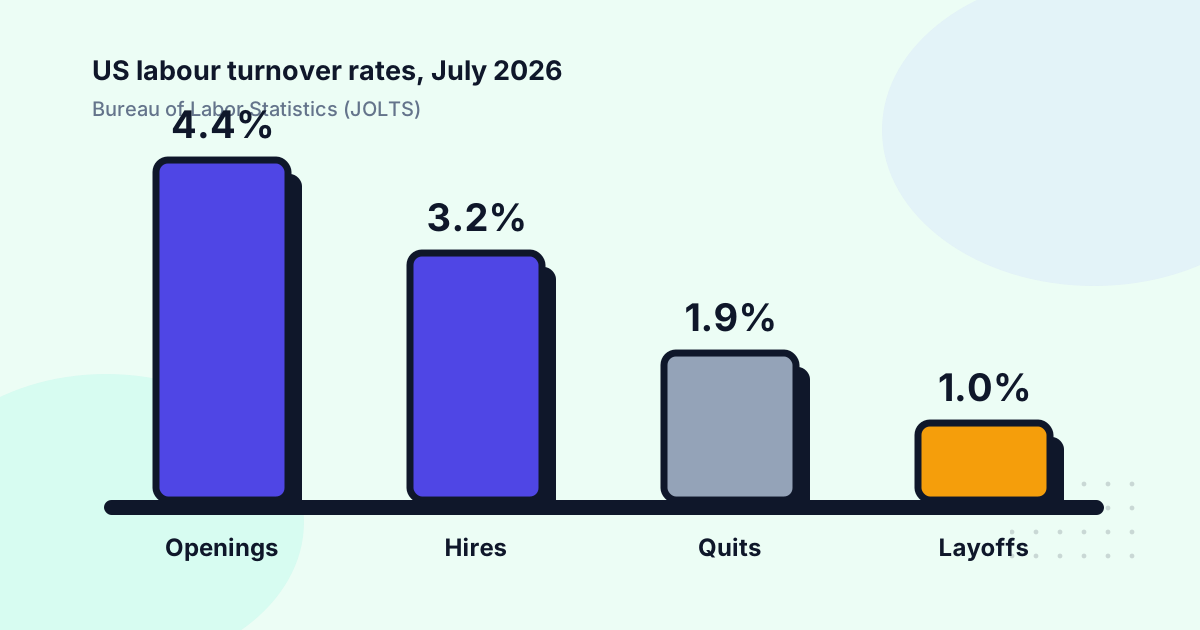
- But layoffs sit at 1.0% and quits at 1.9% — the two lowest numbers on the board.
- Low quits means fewer backfills, so openings turn over slowly.
- Meanwhile each posting draws 244 applications, up 111% since 2022.
- Translation: not a recession. A traffic jam.
What the government data actually says
The Bureau of Labor Statistics publishes JOLTS — Job Openings and Labor Turnover — every month. Here’s July 2026, released 1 September:
| Measure | Level | Rate |
|---|---|---|
| Job openings | 7.3 million | 4.4% |
| Hires | 5.1 million | 3.2% |
| Quits | 3.1 million | 1.9% |
| Layoffs and discharges | 1.7 million | 1.0% |
Every one of those was “little changed” from the month before. That’s the story: nothing is moving much in any direction.
Why it matters: a 1.0% layoff rate means employers are holding onto people. A 1.9% quit rate means workers aren’t leaving voluntarily either — which is what actually generates most job openings in a healthy market. When nobody quits, nobody needs backfilling, and the openings that do exist are new roles or hard-to-fill ones.
Why it feels worse than the numbers look
Because you’re not competing against the openings figure. You’re competing against everyone else aimed at the same openings.
Greenhouse’s March 2026 benchmark report — 640 million+ applications across 6,000+ companies — found applications per job rose 111%, from roughly 115 in 2022 to 244 in 2025. Recruiting teams were cut roughly in half over the same period.
So: roughly the same number of doors, twice as many people at each one, half as many people inside opening them.
That’s a fundamentally different experience from a market with fewer jobs. The jobs exist. The queue is the problem.
What this changes about how you search
Stop reading silence as a signal. In a low-velocity market, slow and quiet is the default, not a verdict on your resume.
Expect it to take longer than it used to. Not because you’re worse, but because each requisition sits in a longer queue and moves through fewer hands.
Channel matters more than volume. The same Greenhouse data has external job boards producing 49.9% of applications and 22.6% of hires, versus company career sites at 23.8% of applications and 34.4% of hires. In a crowded market, the door you use is one of the few levers still fully in your control.
Referrals get disproportionately better. They’re 11.6% of hires off a small share of volume. When the queue is the bottleneck, skipping the queue is the whole game.
Bottom line: if you’re employed, this is a fine market to be picky in and a slow one to move in. If you’re not, the search is genuinely harder than it was in 2022, and that’s a fact about the market, not about you.
FAQ
Are there actually fewer jobs than before? There are 7.3 million openings, which is well above pre-2020 norms but below the 2022 peak. The bigger change isn’t the count of jobs — it’s that far more people are applying to each one.
Why does everyone say the job market is terrible if layoffs are low? Because “low layoffs” and “easy to get hired” are different things. A low-fire market is safe if you’re already employed and slow if you’re not. Most of the people describing it as terrible are in the second group.
How long should a job search take right now? Longer than you want, and highly variable by field. The useful move is tracking your own funnel — applications, replies, interviews — so you can tell a market problem from a resume problem.
Bloom keeps one master resume and builds a tailored version per posting in a couple of minutes, verifying every line against your source resume — so a longer search doesn’t mean a longer evening on each application. Try it free.
Sources
- U.S. Bureau of Labor Statistics, Job Openings and Labor Turnover Summary, July 2026 (released 2026-09-01) — openings, hires, quits, layoffs levels and rates.
- Greenhouse, The Hire Standard: benchmark report, March 2026 (North America) — applications per job 2022–2025, source mix, recruiter capacity.